|
Automotive Exhaust Analyzer
Build this useful automotive test instrument and stop guessing about your cars emissions.
PHILIP M. VAN PRAAG
THE GROWING NUMBER OF STATE AND federal auto-emission requirements has added yet another burden on just about every motorist. Not only do you have to worry about monthly payments, insurance, and sufficient maintenance to keep your car running down the road, now you also have to worry about the next emissions test. Will your car pass, or will you have to go through the time and often considerable expense to have it “tuned up” and then retested?
Worse yet, even if you are a do-it yourselfer with an “army” of tools, timing lights, and dwell meters, you are still at a disadvantage with regard to emissions tuning. Those items alone are not enough to do the job, and doing what we did in the “good old days” — that is, simply replacing the plugs and points, setting timing and dwell, and then “tweeking” the carburetor until the engine runs smoothly and performs well — just won’t cut it anymore.
Indeed, often the best low-emission set tings for your car will be quite different from those settings that provide the best performance. There is simply no way to optimize those adjustments for, nor adequately predict the results of, an emission test with common service equipment. That’s why you need the digital exhaust gas analyzer that will be described in this article.
That device is a small, easy-to-use diagnostic aid. In a general sense, it monitors combustion efficiency of the engine system. That is vitally important as combustion efficiency directly affects exhaust-gas content. More efficient combustion means more complete burning of the gasoline. That translates to smaller amounts of hydrocarbons and carbon monoxide (CO) in the exhaust. Hydrocarbons and CO are the “polluters” typically monitored by government test facilities. (More about the relationship between combustion and exhaust makeup later.) Specifically, the unit displays CO in concentrations of less than 1% to about 10%, and air/fuel (A/F) ratios from 14.5 down to about 11.0.
The project consists of three parts: an exhaust-gas probe, which is inserted into the auto tailpipe; a “conversion box,” which transforms part of the exhaust into a proportional electrical signal; and a display unit, which amplifies and digitizes the signal for easy viewing. The unit can be used either while the car is stationary, allowing you to make adjustments, or while it is in motion, allowing you to verify those adjustments under dynamic operating conditions.
To simplify the circuitry, a commercially-available clock/timer module is used for the display. It contains an LCD readout, providing easy viewing under al most any lighting conditions. The module’s crystal-controlled timing is also used by the project’s A/D converter to ensure a stable timebase throughout the system. An interesting side-benefit to using the clock module is that the unit can be used as an ordinary clock or stopwatch when not being used to measure exhaust gas.
The unit also contains low-voltage sensing circuitry to prevent faulty readings due to inadequate battery voltage.
Theory of operation
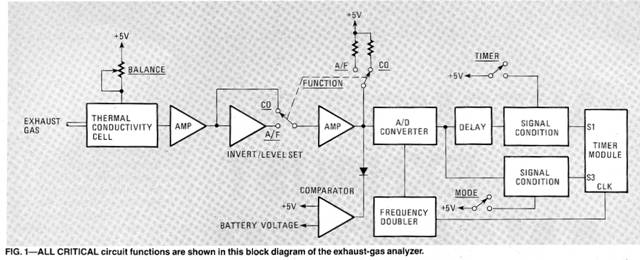
Figure 1 is a block diagram of the primary circuit functions. Exhaust-gas con version takes place in a thermal conductivity cell (TCC). The TCC produces an electrical signal that varies with the difference in temperature between a “test” temperature sensor exposed to exhaust gas and a “control” sensor exposed only to ambient changes that affect both sensors. The sensors are self-heated identically, so that they will be at the same temperature when no exhaust gas is present.
When exhaust gas enters the test-sensor area, the thermal conductivity of the air changes. That affects heat dissipation away from the sensor, thus altering the test-sensor temperature. Changes in sensor temperature cause its resistance to change. In this application, sensor temperature never changes more than a few degrees centigrade, but that is sufficient. It produces enough resistance change to unbalance the TCC. Because of the narrow operating-temperature range, sensor resistance changes linearly with changes in temperature.
At first glance, the difference between thermal conductivity and temperature measurement may not seem clear. They both involve electrical-output changes in response to sensor-temperature changes. In a common “thermometer,” the change in temperature is due to an ambient-air temperature change. In the TCC, however, the temperature change is due to an ambient-air thermal-conductivity change. That is, the ability of heat to dissipate away from the sensor is a function of heat conductivity through the gas mixture. By the time the exhaust gas gets to the test sensor, it has essentially cooled down to ambient temperature. Thus, it is not the temperature of the gas that affects the sensor, but rather the thermal conductivity of the gas.
Thermal conductivity of exhaust gas differs from that of air. The exhaust consists of water vapor, carbon dioxide, hydrocarbons in various gaseous states, and CO. The exact proportions of the different hydrocarbon gases and CO. and their precise relationship to the thermal conductivity of the mixture, is very complex, beyond the scope of absolute measurement for this unit. Fortunately, there are predictable relationships over the temperature ranges of the exhaust gas commonly emitted from a 4-cycle internal combustion, gasoline-drive engine; those can be used to help us in performing auto emission adjustments. Over those ranges, reasonable accuracy and (more important) repeatability can be achieved.
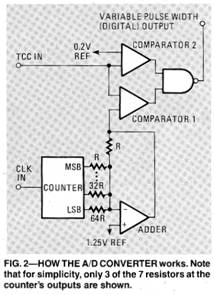
A digital display was chosen because it is easier to read than an analog meter. That is particularly important if the unit is used while driving. Conversion of the analog sensor-signal to digital form is performed by an A/D converter whose operation is shown in Fig. 2. Clock pulses from the timer module are counted, and the results of that count are used by an adder to generate a ramp. Comparator 1 is then used to compare that ramp with the analog sensor-signal. The output of the comparator is a pulse. The duration of the pulse is determined by the amplitude of the sensor signal; that is, the comparator’s output is high as long as the ramp amplitude is greater than the sensor amplitude.
When the ramp amplitude dips below the sensor amplitude, the comparator’s output goes low. The duration of the ramp(2 seconds), and hence the test-cycle length, is determined by the nature of the counter (divide by 128) and the clock frequency (64 Hz).
The output signal is used as a gate to allow a certain number of timer pulses to be counted by the timer module for each test cycle. That output is used to reset the timer from the previous count and define the start and stop of the current count.
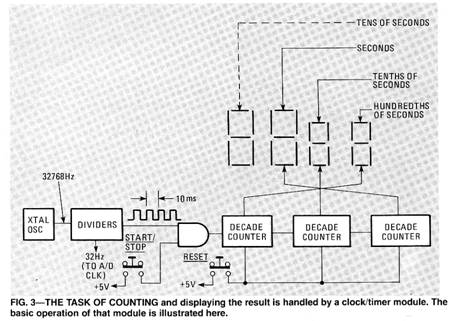
The remaining task of counting and displaying the pulses is accomplished by the clock-timer module. Figure 3 shows the basic timer-module operation. The module is operated in its stopwatch mode, and has a resolution of 10 ms. That means that the display advances by one count every 10 ms. A series of internal counters divide a crystal-controlled 32-kHz oscillator signal down to the desired count rate. The stopwatch START/STOP and RESET switches are operated electrically when power is applied.
The unit uses the three least-significant digits of the display, with an implied decimal point between the two rightmost digits. Thus, a display of 00040 in the CO mode would be a reading of 4.0% while a 00131 display in the A/F mode would be a reading of 13. 1. Note that CO content is expressed as a percentage, while the A/F (air/fuel ratio) is expressed, naturally enough, as a ratio.
Circuit description
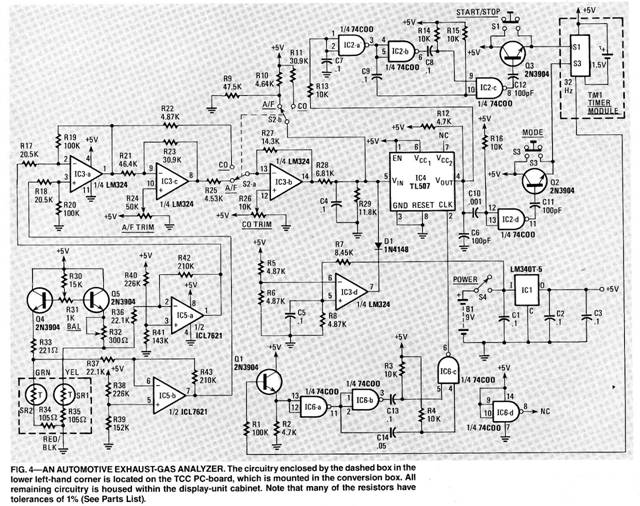
Figure 4 is a schematic diagram of the gas-analyzer circuit. The test and control sensors are precision-matched thermistor glass beads. Those beads are extremely tiny, about .014-inch in diameter. The small mass of the glass bead gives the unit a fast response time. The beads are pre mounted in fixtures, as they would be impossible to handle otherwise. (The bead leads are only .001-inch in diameter!) The fixtures and their housings comprise the TCC within the conversion box. A four-conductor cable routes the sensor signals and ground between the box and the display unit.
tions of IC5, a dual op-amp, are used to amplify the TCC outputs, and inject a fixed bias between them to provide a proper operating point for the next stage.
One section of an LM324 quad op amp, IC3-a,
is used to amplify the TCC outputs, and convert them to a single
ended signal. Another section, IC3c inverts that signal and provides
level translation for the A/F mode. Resistor R24 is a trimmer used
to calibrate for the desired A/F ambient operating point. Final
amplification is provided by IC3-b; that device also provides the CO
operating-point calibration. The fourth section of IC3, IC3-d,
functions as a voltage comparator, sensing the battery input-voltage
to regulator ICI. If the voltage
Transistor QI, and IC6 and its associated circuitry, prepare clock pulses for the
All other circuitry is housed in the display unit. Transistors Q4 and Q5 translate BALANCE control (R3l) changes into the very subtle bridge adjustments needed to “balance” the currents to the test sensors under ambient conditions. The two see - A/D converter (IC4) using a 32-Hz inter mediate-countdown signal obtained from the timer module. Transistor Q1 shifts the timer voltage-levels, while IC6 functions as a frequency doubler to provide the 64Hz signal needed by the A/D converter to define the two-second test interval.
Resistors R9 and Rl0 determine the final ambient voltage-level for the A/F mode, while R11 determines the final ambient voltage-level for the CO mode. Those voltage levels define particular A/D pulse durations, which, in turn, define particular display readouts.
The A/D output is conditioned so that it can be used to control the clock module by IC2 and the Q2—Q3 circuit. One section of the IC, IC2d along with C10 and R16 are used to differentiate and invert the A/D output’s leading edge to form the S3 reset pulse. Another section of the device, IC2a delays the A/D output from reaching the stop/start circuitry until the reset pulse has been applied to the timer module. The IC2b - IC2c circuit is a “double differentiator” that provides short trigger pulses on the delayed leading and trailing edges of the A/D output signal. Those pulses are used to start and stop the timer, By presenting a very high impedance to the timer when the unit is switched off, Q2 — C11 and Q3 — C12 allow the timer module to be used as an ordinary clock or stopwatch when the unit is not being used for exhaust analysis.
Display cabinet and timer module
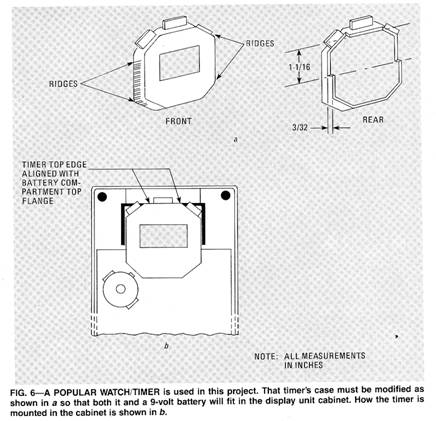
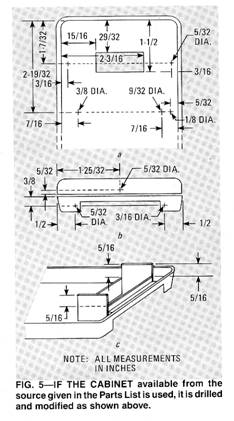
Figure 5 shows display-cabinet preparation details for the cabinet available from the source mentioned in the parts list. (If you purchase the complete kit, the cabinet will already have been completely prepared.) The cutout for the LCD display can be done by first drilling a number of holes within the cutout border, then care fully filing to eventually produce a clean rectangular hole. The bottom of what was intended to be a battery compartment must be cut out to provide a mounting fixture for the clock / timer module. The detail for that is shown in Figure 5-c.
side ridges are carefully filed just to the point of allowing a light press fit in the cabinet. In any event, provision must be made to allow the module to be removed, as must be done to insert or remove the PC board. Removal may also be needed to change the timer battery, although if the bottom battery retaining-clamp screw is left a little loose it is possible to change the battery through the battery-compartment access lid.
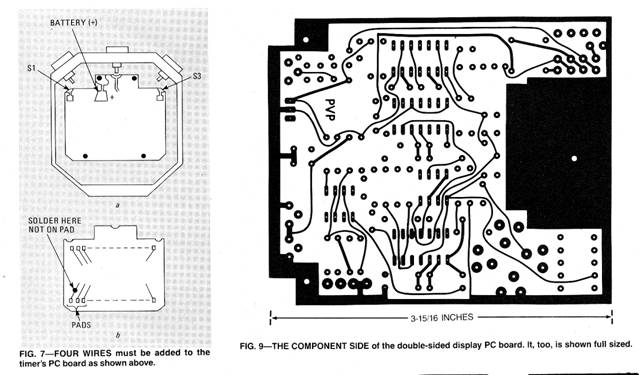
Four wires have to be added to the timer module to interface it with the rest of the circuitry. Figure 7-a shows where three of those wires are attached: shown there is the side of timer’s PC board that’s seen when the timer’s back cover is removed. The fourth wire is attached to the other side of that board as shown in Fig. 7-b. To gain access to the timer-circuit board, pry off the back cover, then very carefully remove the four small chrome Phillips head screws that hold the mechanism in place. Note the locations of the screws as well as the orientation of the battery retaining clamp. You should now be able to lift the molded black plastic lid away from the circuit board. Carefully solder three fine (30-gauge) wires in place, using very little solder and trying to keep the wires and solder close to the edge of the PC board.
Next, very carefully lift out the spring steel switch strip using a pair of needle nosed pliers; note the position of the strip—it is over two small red-plastic studs. Then, remove the circuit board by gently lifting from beneath at various points along the edge of the board. When the PC board is removed, the LCD display will probably stick to it. If it does, carefully separate it from the board, noting its orientation and setting it back into the case exactly as it was before the board was removed. (That is important because there is usually no pin identifications on those displays.) Using a jeweler’s screwdriver, very carefully scrape the green lacquer coating off the PC pattern at the point shown in Fig. 7-b. Do not touch any of the pads that mate with the LCD display. Using a very fine-tipped soldering iron, and a small amount of solder, tin both the exposed copper foil and the wire to be attached. Do not allow any solder or flux to contact the pad located below the trace. Touch the wire and the iron to the point that was tinned to attach the wire.
Display-electronics construction
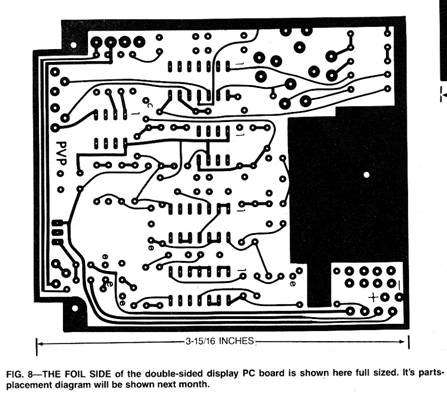
Full-size PC-board patterns are shown in Figs. 8, 9, and 10. We recommend using PC boards, as that will considerably reduce construction and debugging time. It will also help eliminate the possibility of any high-impedance-leakage paths or spurious-signal pickup. The use of IC sockets is recommended as those allow easy IC removal/replacement should servicing ever be required.
Full-size foil patterns for the double sided display PC board are shown in Figs. 8 and 9. If you choose to etch your own board, and cannot provide plated-through holes, you will have to solder all component leads on both sides of the board. In addition, you will have to insert a wire into all pads that do not contain component leads, then solder those feed through wires on both sides of the board.
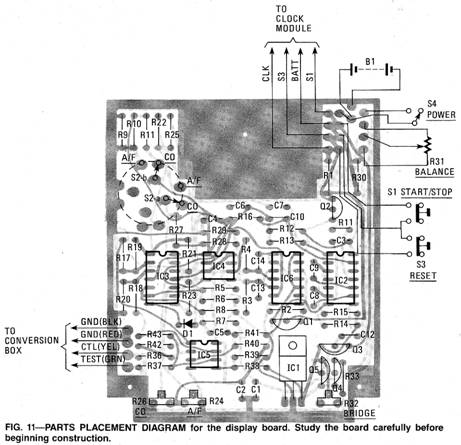
Figure 11 is the parts-placement diagram for the display board; Fig. 12 is the parts-placement diagram for the TCC board. Note that the four-conductor cable on the TCC board (Fig. 12) is installed on the foil side. Be careful to orient all IC’s, diodes, and polarized capacitors as shown. Use a 25-watt iron with a fine pointed tip, and .030-inch solder.
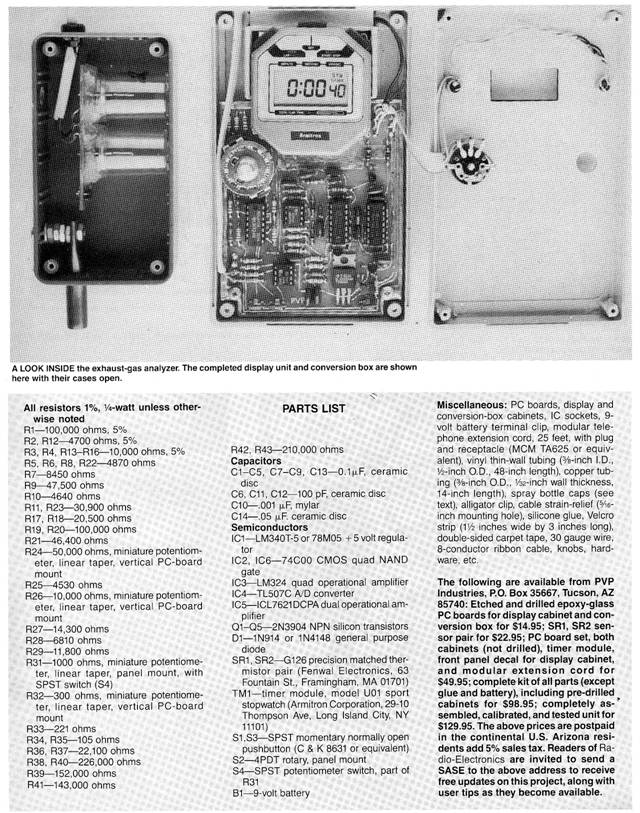
One point should be made here about the resistors. Note that the majority are precision 1% units. Such resistors are now available from a number of sources, including Digi-Key (Highway 32 South, P0 Box 677, Thief River Falls, MN 56701). A less expensive alternative for those who have well stocked junk boxes ‘is to test more common 5% resistors with a DMM until ones with the precise value called for are found.
Study Figs. 11 and 12 before starting construction of the boards, and decide upon a method of attack for inserting the components. Although individual styles differ, the following sequence should work well. The idea here is that by sequencing the parts installation according to the height of the components, several similar components can be inserted on the board before the board is inverted and the parts soldered in place. That should speed things up a bit,
First, install the horizontal-mount fixed ¼-watt resistors, slightly bending the leads after insertion to avoid mis-positioning when the board is inverted for soldering. (To help in troubleshooting, should it become necessary, orient the resistors so that all the first bands point in the same direction. That also makes the project look a lot neater.) After soldering the resistors in place, trim the leads flush with the solder mounds. Next, install the IC sockets, making sure that the notch, or dot, on one end of the socket is aligned with pin 1. Note that the IC’s themselves, with the exception of IC1, are not to be installed now. As IC1 is a voltage regulator, it is not socketed. Instead, solder that device directly to the board at this time. Then mount the diodes making sure that they are oriented properly. Next, in stall the capacitors beginning with the physically smaller types. Next, mount the trimmer potentiometers: R24, R26, and R32. Then mount transistors Q1—Q5.
The function switch (S2) shaft must be trimmed to a 3/8-inch length. When that has been done, mount it on the PC board, but only after the cabinet top has been drilled and can be used to check switch alignment. That is important since the switch cannot be moved once it is soldered in place. If it is crooked when in stalled, it will not allow the top to be attached properly. Set the switch into the board (noting the rotational alignment shown by the tab position in Fig. 6-b). It may be necessary to straighten some of the contacts before it can be smoothly inserted. The switch should be inserted in the board to a depth such that about 1/16 inch of the solder contacts protrude out beyond the bottom of the board. Then lightly solder one or two contacts and temporarily install the PC board in the cabinet bottom. Check to see that the top cover will fit without binding at the switch shaft clearance hole. When satisfied, re move the PC board and complete the con tact soldering.
The four-conductor cable interface between the display unit and the conversion box is made using a modular telephone extension cable with plug and receptacle assembly. Cut a 9-inch section of the cable at the plug end, and use that to connect the PC boards. Figures 11 and 12 show how the boards are interconnected. The color scheme indicated is not mandatory, but following it will minimize any chance of confusion. Note that the receptacle is mounted on the conversion box and wired to the TCC board. Doing that allows the conversion box to be disconnected from the display unit when not in use.
Figures 11 and 12 show how the boards are interconnected. The color scheme indicated is not mandatory, but following it will minimize any chance of confusion. Note that the receptacle is mounted on the conversion box and wired to the TCC board. Doing that allows the conversion box to be disconnected from the display unit when not in use.
Turning to the off-board components, use small-gauge, color-coded wires for the connections to S1 and S3. Twist them rather tightly to prevent spurious ignition noise pick-up that otherwise could occur with some automobiles. (The noise pick up would cause erratic timer triggering and occasional faulty display readings.)
When construction of the display board is complete, clean off all solder-flux residue with isopropyl alcohol or commercial spray flux-remover. If using a commercial flux remover be sure to read the directions as some of those are harmful to plastics.
Conversion box preparation
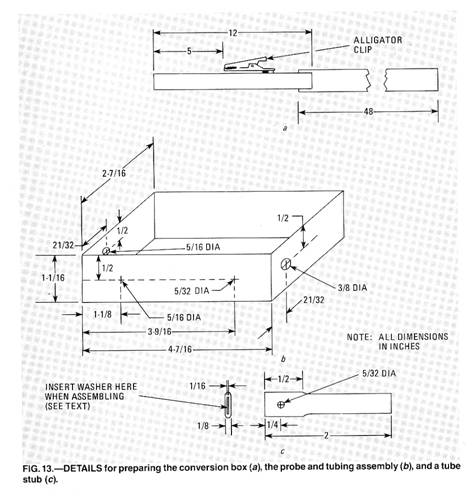
Figure 13-a shows the conversion-box preparation details for the box available from the supplier mentioned in the parts list. Also shown is the probe and tubing assembly (Fig. 13-b). The probe is built using 3/s-inch outside diameter (0.D.) copper tubing, with an alligator clip add ed to make sure that the probe remains in the auto-exhaust pipe when it is placed there. A 48-inch length of 3/s-inch I.D. (Inside Diameter), ½-inch 0.D., vinyl tubing connects the probe to the conversion box. (Note that if you purchase the complete kit from the source mentioned in the parts list, all cutting and drilling will already have been done.)
A 2-inch copper tube stub (see Fig. 13c) is needed to attach the vinyl tubing to the conversion box. Crimp a 7/16-inch length of one end in a vise to obtain the flattened dimensions indicated. Then drill a 5/32 inch hole where shown. Insert a No. 6 flat washer 1/8 inch O.D., ¼ 2-inch thick) into the flattened portion when assembling as discussed below. Flattening of the stub and inserting the washer creates a controlled inlet aperture. That aperture limits the exhaust-gas flow rate into the conversion box, ensuring adequate gas cooling before exposure to the TCC.
Velcro strips can be used to allow attachment of the conversion box to the automobile. First, glue the “fabric” portion of the strip to the back of the con version box. Then, double-sided carpet tape can be applied to the mating Velcro strip for attachment to the bumper. (Never stick the tape onto a painted portion of the car, as the paint is likely to come off when removing the strip later on.)
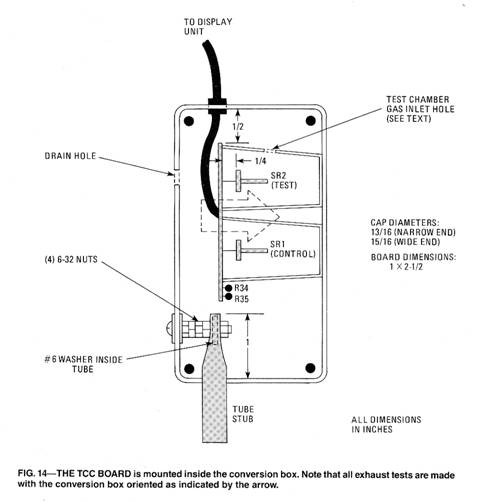
Figure 14 shows the component and board placement within the conversion box. As shown, the sensors should be mounted ¼-inch above the PC board. Plastic spray-bottle caps (with approximate dimensions as shown) should then be glued to the board over the sensor assemblies. Try to center the caps around the sensor fixtures. Silicone glue may be used, although 3M windshield adhesive (available at automotive-parts stores) is even more effective. Apply the glue to the mating surfaces only, when the caps are in place, coat the outer cap and the board surfaces with additional glue to be certain of a good seal. Once the glue is firm, melt a hole into the test-sensor cap where shown in Figure 14. (The hole should face the side of the conversion box that contains the strain-relief/cable assembly.) Holding a 1/4-inch diameter screw with a pair of pliers, heat the screw with a candle flame and use it to melt a hole through the plastic. The cap/board assembly should then be silicone glued to the side and bottom of the conversion box. Be sure to use ample amounts of silicone glue around the control sensor, as it is vital that no exhaust gas he allowed to reach it.
Assemble the tube stub as shown in Fig. 14 using four 6-32 nuts to space the stub from the side edge. Don’t forget to place a No. 6 washer inside the flattened tube end before tightening the outside 6-32 nut. When the four “spacer” nuts are snug, tighten the outside nut with a small wrench or pliers until the tube end is compressed against the washer inside the tube. Thus, gas will be allowed into the box only at the top and bottom of the washer, and to a small degree through the outer sides.
Battery operation
Two self-contained batteries are used by the unit. One is a hearing-aid type 1.5 volt cell. The other is a common 9-volt transistor-radio-type battery. The 1.5-volt cell is used in the timer module and its life expectancy is over one year.
The 9-volt battery powers all of the remaining circuitry. Current drain is rather high due to the required thermistor heating. Therefore, the unit should only be turned on when exhaust measurements are needed. Also, when replacing the battery, be sure that the unit is off (to prevent damage).
Checkout and calibration
The following calibration/test procedures are performed with the probe exposed to ambient air-conditions only. Do not allow exposure to exhaust gas at this time. Double-check all connections and component orientation. Do not install the IC's into the sockets yet. (Only IC1, which is soldered in place, should be in stalled to this point.)
If you haven’t re-installed the timer battery yet, do so now, and verify that all that all of the timer’s functions operate as de scribed in its owners booklet. With no external power applied to the unit, all timer functions should be just as they would be normally. If that is not the case, do not proceed until you have isolated and corrected the problem. Try disconnecting the four wires from the display PC board. If operation returns to normal, then some thing is probably miswired in the Q1, Q2, or Q3 circuitry. If timer operation is still faulty. then either the wire connections on the timer board are bad (for example, solder bridging across two circuit paths) or the timer module is bad.
Before connecting the conversion-box cable to the display unit, apply power via S4. Check the voltage at IC12. It should be + 5 volts. Leave the power applied for a few minutes, then touch IC1 It should be just slightly warm, not hot. If all is well, remove power, connect the conversion-box cable, and install the remaining IC's Then set the BALANCE control (R31) and trimmer potentiometers R24, R26, and R32 to their midpoint positions, and set the FUNCTION to the co position.
If the timer had been in the normal clock mode, you must change it to timer mode by holding S3 depressed for a few seconds until the display changes to all zeros. Now re-apply power. After several seconds, the display should begin to respond to the initiation of tests about every two seconds.
If the word LAP appears on the display (below the two smaller digits on the right), that means the count/reset sequence is out of step. That may occasionally happen after power up. Simply depress the TIMER switch one time. That should clear the counting abnormality within two or three test cycles.
Now proceed with the calibration process, as follows. Again, be certain that there is no exhaust gas near the conversion box, and that its temperature is stable. Also, orient the conversion box as shown in Fig. 14. (That is the orientation that will be used during actual exhaust testing.)
1. Connect a DVM between the display-board pads for the green and yellow leads to the TCC board. Adjust R32 for a reading of exactly 0 volts. There will be some settling time required, so leave the DVM connected for about 30 seconds.
2. Adjust R26 for a display of 4.0% Take your time in doing that step as it is rather critical. Make the adjustment in small increments until the reading changes with each test cycle. If movement in one direction doesn’t produce a display change, go back to midrange and try the other direction. When you do start seeing a change, continue to adjust, but in even smaller increments, until the display reads 4.0 consistently on several subsequent tests.
3. Switch to the A/F mode, and adjust R24 for a 13.1 display. Follow the procedure outlined in the previous step.
That completes the checkout and calibration process. The settings of R24, R26, and R32 should not require readjustment under normal circumstances. The BALANCE control should give you enough of an adjustment range to compensate for any subtle variations due to component aging or imbalances at particular ambient temperatures.
WARNING: Exhaust gas is poisonous! Do NOT ever perform any exhaust-gas tests in an enclosed or poorly ventilated area! Even being inside a car with the windows rolled up is no assurance of safety. While the system itself is designed so that gas is sampled and converted to an electrical signal outside the car, exhaust gas can seep into the car in many other ways. Do NOT take chances!
Setup
The first step is to attach the conversion box to the rear-bumper area. Choose a position that allows the tubing and probe to reach the exhaust tailpipe without stretching or sharply bending the tubing. Also, observe the mounting direction as outlined earlier. Velcro strips may be used to attach the box, but they may not be suitable for all applications. Other alter natives may be necessary, such as masking tape. An especially sturdy mounting is not needed unless the unit is to be used while driving, in which case adequate means must be provided to prevent a change of position or the device even falling off the car. Do not attach the probe until after the balance operation described below has been performed.
Before the unit can be used, two things must be allowed to happen: One is that the engine must be allowed to reach its normal operating temperature (about 10 minutes in mild weather), and the other is that the test unit must be allowed to stabilize (about 1 minute). If you warm up the car while allowing the unit to stabilize, be sure that no exhaust gas is allowed to reach the conversion box until after the balance operation is performed. Also, never start the engine while the probe is inserted in the tailpipe, as the initial surge of exhaust is extremely “dirty,” and could coat the TCC, altering the unit’s accuracy. A small piece of tape may be placed over the conversion-box gas-inlet stub and drain hole during warm up to ensure that exhaust gas will not enter at that time.
In use, all functions are displayed when the timer is in the stopwatch mode. If the timer is in the clock mode, depress the MODE switch for a few seconds until the display reads all zeros. That can be done whether or not power has been applied. In fact, if power is not applied, the unit can be used as an ordinary stopwatch. Once power is applied and the unit is placed in the STOPWATCH mode, the display should begin to change in response to each test cycle.
The unit uses the three rightmost display digits for readout, with an assumed decimal point between the rightmost two digits. Thus, a 134 display in the A/F mode indicates a 13.4 air/fuel ratio while a 036 display in the CO mode indicates a CO content of 3.6%.
To activate the unit, rotate the BALANCE control from its off position to about mid range. As explained above, allow a brief warm up period. That allows time for pre heating the TCC sensors, and generally allows the system to become acclimated to ambient conditions in the test environment. Once the display stabilizes, adjust the BALANCE control for a reading of 4.0 in the co mode or 13.1 in the A/F mode.
When the engine is running at normal operating temperature, insert the probe into the tailpipe, and attach the tubing to the conversion box. There will be a very brief response lag-time encountered as the display changes to reflect the thermal conductivity of the gas sample. (Note that a new sample test is performed about every two seconds.) It is normal for some fluctuation “drift” in adjacent readings, particularly if the engine is idling rough, or if the engine system routinely changes idle speed timing, or carburetor mixture in response to engine temperature.
If your automobile has a catalytic converter, accurate readings can best be obtained by sensing the exhaust gas before the converter. While some autos have a port available for this testing, it will probably be necessary to remove the exhaust gas recirculation (EGR) valve and insert the probe at that point in the system. (It will then be necessary to close off the EGR line to the intake manifold to ensure accurate readings.) The catalytic converter changes much of the hydrocarbons and CO into water and carbon dioxide. That “new” gas/vapor mixture presents a different composite thermal conductivity to the TCC thus affecting accuracy.
Adjustments
When making adjustments, be sure to allow time for the display to respond. It takes time for the engine system to stabilize on the new setting(s), and then it takes a short time for unit to respond to the different exhaust-gas content. If the unit is to be used on more than one vehicle during a session, allow several minutes for remaining exhaust to clear the conversion box before connecting it to the next vehicle. When making adjustments that typically have a broad range. It is best to make small incremental changes, pausing after each and then noting the display. That method makes it easy to “zero-in” on the optimum setting without losing control: that is, getting things so far out of adjustment that the engine dies, or that it is difficult to return to the original set tings.
The following emission-related component topics are intended for general in formation only. Specific adjustments for your auto should be made in accordance with the auto makers prescribed methods. Occasionally. emissions tune up procedures and data will be included on decals in the engine compartment. Other wise, consult an appropriate service manual for details. It is a good idea to take a CO reading before making any repairs or adjustments so that you can later measure your progress by before / after comparison.
It is wise to begin by checking the ignition components: replace, clean, or re gap spark plugs as needed: set point dwell and ignition timing to manufacturer specifications: check spark plug wires; and clean/inspect distributor cap.
Equipment added to modern auto mobiles to reduce emissions include (in part) the following items. They should be inspected, cleaned, replaced, or adjusted as recommended by the auto maker.
1. Air-inlet temperature damper (routes preheated air to carburetor during engine warmup).
2. Air pump (pumps air into exhaust manifold area to improve combustion efficiency).
4. EGR (routes portion of exhaust back to carburetor).
5. PCV (Positive Crankcase Ventilation system—routes “blow-by” gases back to carburetor, and al lows fresh air to enter crankcase).
6. Spark-timing advance (three common types: deceleration-vacuum control, transmission-gear-shift control, and engine temperature thermostat-vacuum control).
7. Thermostat-engine coolant (higher temperature thermostats being used).
Proper carburetor operation is vital to minimizing exhaust pollutants. All passages and internal/external components must be clean, and gaskets must be secure to prevent air or fuel leaks. Once that has been accomplished, the various adjustments must be set to the manufacturer’s instructions. Those adjustments typically include float, choke, throttle, and air/fuel mixture, but may include other things, such as multi-carburetor synchronization. While “in the old days” simple cookbook adjustment procedures could be given (for example: “tighten down mixture screw, then back off 3 turns...”. today that is just not possible. The importance of using a CO meter and strictly following the automakers’ adjustment instructions is no better exemplified than with the carburetion setup.
Readings
As mentioned earlier, auto makers typical ly provide emissions-adjustment in formation in the engine compartment. That information often includes CO and A/F readings that should be attainable if all systems are functioning properly. Tune-up manuals will also provide that information. Of course, it is also important to know your state’s prescribed maximum CO limits for your make, engine, and year auto. Those limits vary consider ably.
In Arizona. for example, a 1972 Ford Pinto with a 4-cylinder engine is allowed 6% CO maximum. A 1981 Dodge Aries, also with a 4-cylinder engine, is only al lowed l.5Y CO maximum. A 1973 12 cylinder Jaguar XKE is allowed 5.5% CO. Some auto types seem to be rather amenable to achieving even very stringent requirements, while others (like the Jaguar mentioned above) just barely squeak by relaxed requirements, and then only after considerable effort. In general, however, 10- or 15-year-old cars should be able to deliver about 3% - 4% CO. while the very latest cars should be down to about 1%.
Air/fuel ratio measurements are especially meaningful when making carburetor adjustments. Once again, it is important to consult the manufacturer’s data for recommended procedures and readings. It can be injurious to the engine valve system, for example, to set the mixture too lean. The few pennies saved in fuel will be more than offset by subsequently having to repair burned valves, due to excessive combustion temperatures. Air/fuel readings above about 14.0 indicate a lean mixture (i.e., more air, less fuel) while readings below about 12.0 indicate a rich mixture.
The advantage of using the unit while driving is to verify A/F carburetor settings and general carburetor/accelerator pump response under actual operating conditions. At cruising speeds, with a light engine load, the A/F reading will normally be a little leaner (by about .3 or .4) then when the auto is stationary. After sudden, brief acceleration the reading should diminish considerably, then gradually rise back to nominal. Service data for your auto should provide specific load readings.
Suspicious readings
Sooner or later, you will probably en counter readings that just don’t seem to make sense. There can be many sources of inaccuracy, but first it is important to determine the general cause. There are three general causes to consider: the automobile, the setup. or the unit itself. Once the general cause is found, the specific problem is much easier to track down.
One common auto symptom is the carburetor - mixture control not having any effect on CO readings. That is a “normal” occurrence if the carburetor needs over hauling. What has happened is that blockages or leaks in the carburetor have disrupted normal operation enough to make the relatively minor mixture-screw changes ineffective. It is also possible that the air filter is clogged. To verify, note the A/F reading, then remove the air-cleaner element, re-attach the air-cleaner cover, and retest. If A/F ratio is now more than .2 or .3 higher than before, the filter probably needs replacing.
Another source of potential trouble from the automobile, as mentioned earlier. is “swamping out” of the TCC due to an unusually dirty exhaust blast, such as that which would occur if the engine is started with the probe attached. Swamping can also occur if an adjustment is made, while testing, that causes a very dirty exhaust. Swamping typically is manifested by a suspiciously low CO reading, or a suspiciously high A/F reading. (In extreme cases, the CO reading may “attempt” to reach zero. When that happens, the display will stop updating entirely. The display will remain “frozen” until the TCC clears—typically 10—15 minutes after the offending gas mixture is removed.) The best way to correct that is to shut off the engine and allow the TCC to “breathe” ambient air for 15 minutes or so. Another solution is to deliberately force a rich mixture situation (such as by temporarily blocking part of the air intake to the carburetor) until the CO percentage swings up a few percent (or the A/F reading is down considerably); then allow normal air flow and check the reading after about a minute. If it returns to the same super-low CO. or super-lean A/F, then that’s most likely the real situation, unless one of the remaining two possible trouble areas is at fault.
If the setup is suspected, re-check the setup conditions mentioned earlier. It is important that all conditions be met, such as positioning of the conversion box and allowing sufficient time for the system to stabilize before balancing and then beginning the test. It is also possible that accuracy could be affected if a significant temperature change occurs in the conversion box area after balancing has been performed. An example of that might be if the sun came out from behind a cloud and significantly changed the ambient temperature conditions around the conversion box. Although immune to subtle changes in ambient temperature due to the “control” sensor presence, very large temperature-changes can cause a shift in the balance point. To re-balance, the TCC needs to again “breathe” ambient air for several minutes: then reset the BALANCE control.
A particularly perplexing symptom is where the display is erratic; that is, where the unit is obviously performing tests, but with significantly different readings on each trial. Verify that swamping or improper setup is not influencing the readings by shutting off the engine and observing the readings over several minutes, making sure that the conversion box remains in the same position and ambient temperature. If the readings remain erratic. there is a problem with the unit’s electronics. But, if the readings stabilize, there is either something wrong with the setup or you have a really weird exhaust mixture.
The whole business of emissions testing is very tricky. Those of you who own “marginal” cars (remember that Jaguar we mentioned!) know what we mean. Each emission test can bring new surprises—sometimes good, sometimes bad. The same car, with the same tank of gas, with the same emission settings, can produce different readings at different times. There always are reasons, but sometimes they can be quite difficult to determine. In states such as Arizona that allow “conditioning mode” testing if the initial test fails, the auto is run at accelerated engine speeds, in gear on rollers, for about 30 seconds and is then retested often with dramatically lower readings. Everything is exactly the same as before, except that some of the excess combustion byproducts (built up, perhaps, during the long wait in line to be tested) have been blown out.
The message here is: Don’t be alarmed if any particular readings appear to be somewhat different from the last readings taken. To best determine the state of exhaust emissions, you really need to average the readings. In particular, take note of subtle changes in test conditions that can affect the results. Paying attention to those details will improve the overall usefulness of the unit and rectify the emissions from your automobile, thus improving the quality of air we breathe—and that’s what it’s all about! |
 drops
below 7.2, the pin 7 output goes to ground, which loads down the
output of IC3-b, causing the device to stop update testing. Then
it’s time to replace the battery.
drops
below 7.2, the pin 7 output goes to ground, which loads down the
output of IC3-b, causing the device to stop update testing. Then
it’s time to replace the battery.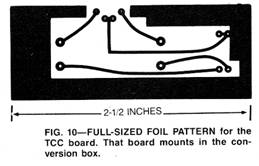
 Caution:
Before proceeding with any modification to the clock-timer module,
be certain that it is functioning correctly in all modes of
operation. Once it has been modified the manufacturer will not honor
warranty claims.
Caution:
Before proceeding with any modification to the clock-timer module,
be certain that it is functioning correctly in all modes of
operation. Once it has been modified the manufacturer will not honor
warranty claims.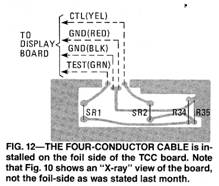
 Next,
set the PC board into the case along with the switch-contact strip.
Reinsert the molded black plastic lid and the screws (do not over
tighten), dress the wires up out of the way, and make a note of the
wire colors for later identification when connecting them up to the
gas analyzer’s PC board. The timer’s back cover will not be used in
the cabinet.
Next,
set the PC board into the case along with the switch-contact strip.
Reinsert the molded black plastic lid and the screws (do not over
tighten), dress the wires up out of the way, and make a note of the
wire colors for later identification when connecting them up to the
gas analyzer’s PC board. The timer’s back cover will not be used in
the cabinet.Copyright by Bill Bytheway, K7TTY February 2012